MUNICIPAL ELECTRICITY COST-OF-SUPPLY

Calculate. Design. Model.
Submit to NERSA.

CoSight connects annual municipal data, the Cost-of-Supply model, category-level tariff design, scenarios and submission evidence in one traceable workflow.

STEP 6 · COST-OF-SUPPLY MODEL
Tariff Design & Setting
FROM MUNICIPAL DATA
CUSTOMER CATEGORYCURRENT BILLCOST-REFLECTIVEPHASED BILLYEAR 1
Residential
FIXED · DEMAND · ENERGY
R 248.00R 285.20+15.0%
+15.0%
GUIDELINE
Commercial
FIXED · DEMAND · ENERGY
R 4,860R 5,291+8.9%
+8.9%
PHASED
Industrial
FIXED · DEMAND · ENERGY
R 84,320R 89,130+5.7%
+5.7%
PHASED
FIVE-YEAR TARIFF PATH
Planned movement
FROM MODEL
Y1
Y2
Y3
Y4
Y5
AVERAGE TARIFF
240.2 c/kWh
YEAR 1 MOVE
+15.0%
LOSS INPUT
13.0%
SOURCE
Accepted data
FIXED · DEMAND · ENERGY•CURRENT → COST-REFLECTIVE•PHASED OVER FIVE YEARS
One annual workflow

From source documents to a tariff you can explain.

Every stage carries its data, sources and decisions forward. Municipal teams can return later in the year, add newer information and model a fresh scenario without losing the earlier record.

01

Annual intake

Confirm the year’s core energy, money, asset and tariff-category figures.

02

Data & documents

Read source files, preserve exact records and accept mapped totals.

03

COS model

Turn ring-fenced municipal inputs into a traceable revenue requirement.

04

Tariff design

Translate cost into fixed, demand and energy charges by category.

05

Scenarios

Adjust real drivers, compare outcomes and return later with newer data.

06

Sign-off

Record owners, declarations, evidence and review decisions.

07

Submission readiness

See the outstanding annexures and prepare the final evidence pack.

The platform today

Rich enough for the study. Clear enough for the people responsible.

The platform joins specialist calculations to a guided municipal process, with the evidence and context needed by finance teams, electricity teams, reviewers and councillors.

Annual intake

One annual form. Every figure keeps its source.

Uploaded municipal data fills the form first. Remaining gaps can use the municipality’s decision history, a comparable-licensee benchmark or a declared default — each visibly labelled for review.

Five focused pages
Live loss and category checks
Draft, review and sign-off
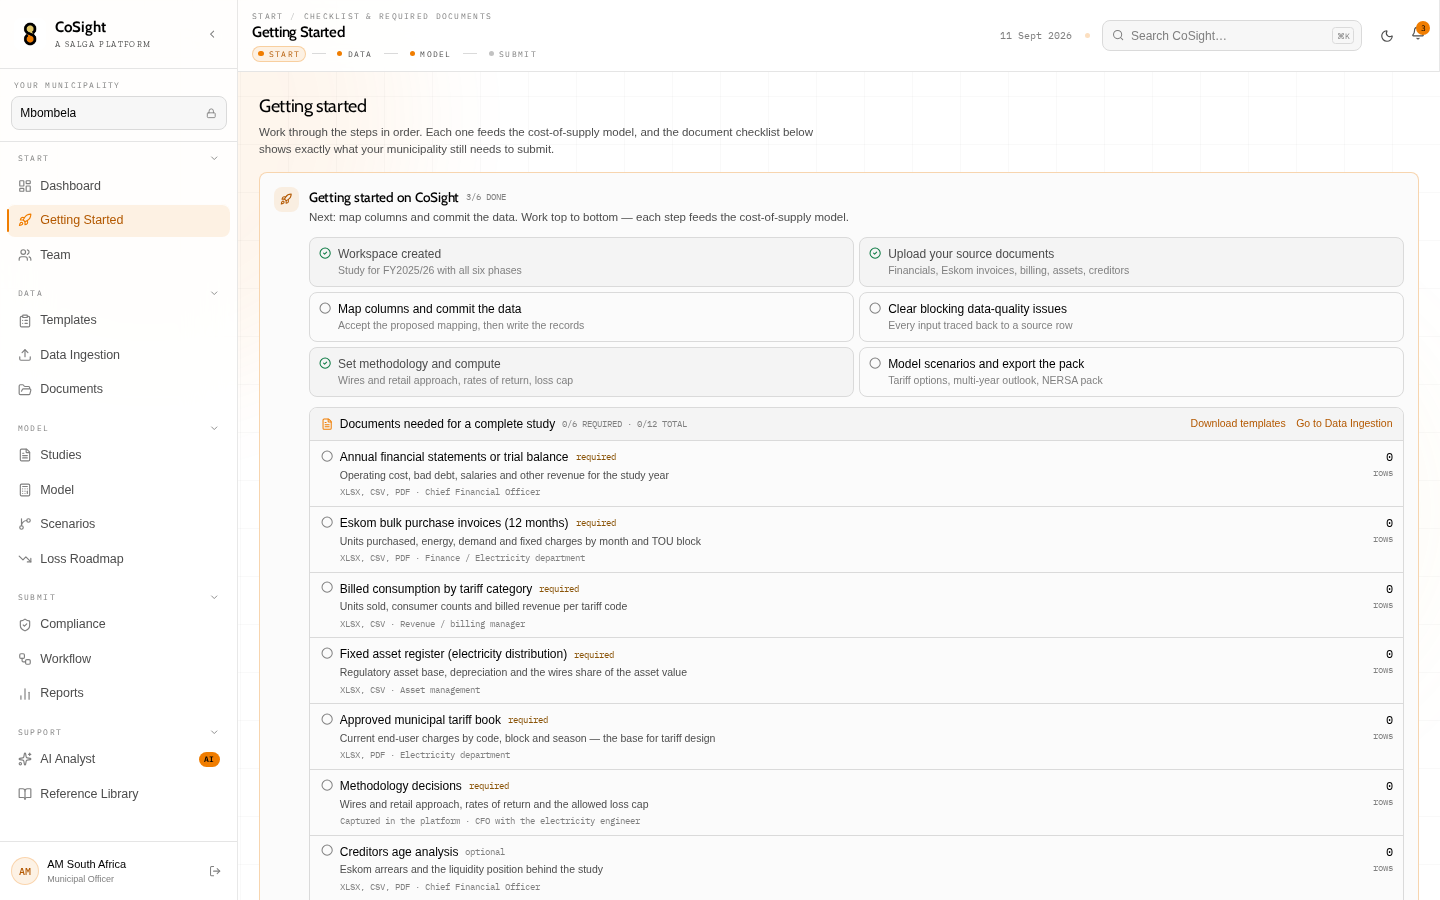
CoSight municipal getting-started checklist
Ingestion and provenance

The calculation can be traced back to the source record.

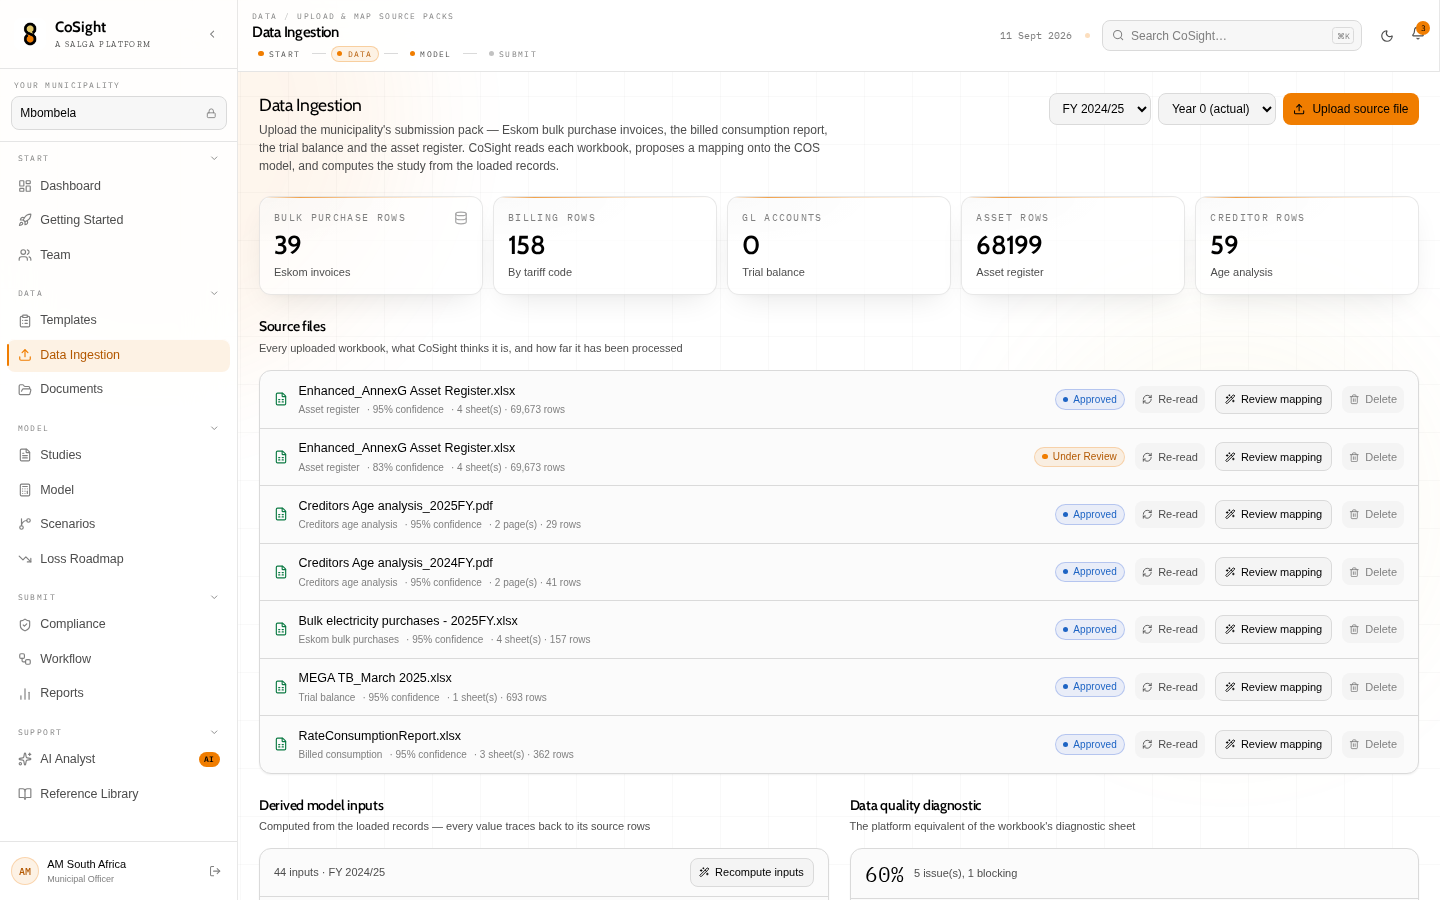
The upload flow reads XLSX, CSV and PDF files, presents the interpreted totals and mappings, and waits for acceptance before adding canonical facts to the municipal workspace.

Exact source rows preserved
Mapping and reconciliation context
Input-to-output provenance
CoSight data-ingestion workspace
Scenario modelling

Re-model the submission when the year changes.

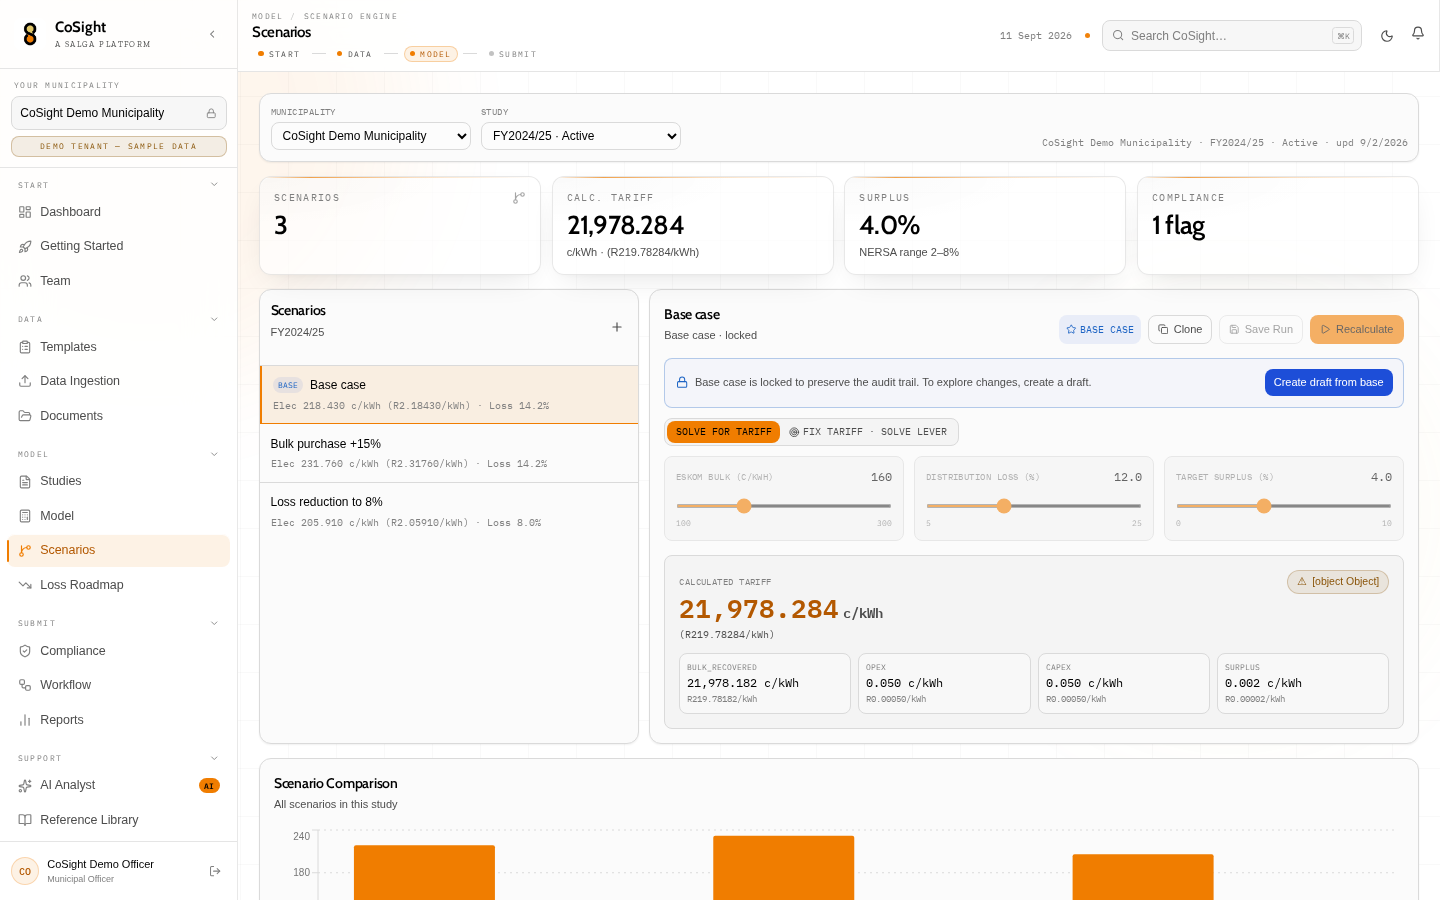
A saved scenario remembers its data year, drivers and result. Adjust losses, purchase costs or return assumptions, compare against the base case, then re-run on the latest accepted data.

Live driver recalculation
Saved modelling sessions
Base and what-if comparison
CoSight scenario-modelling workspace
Submission readiness

The answer and the evidence stay together.

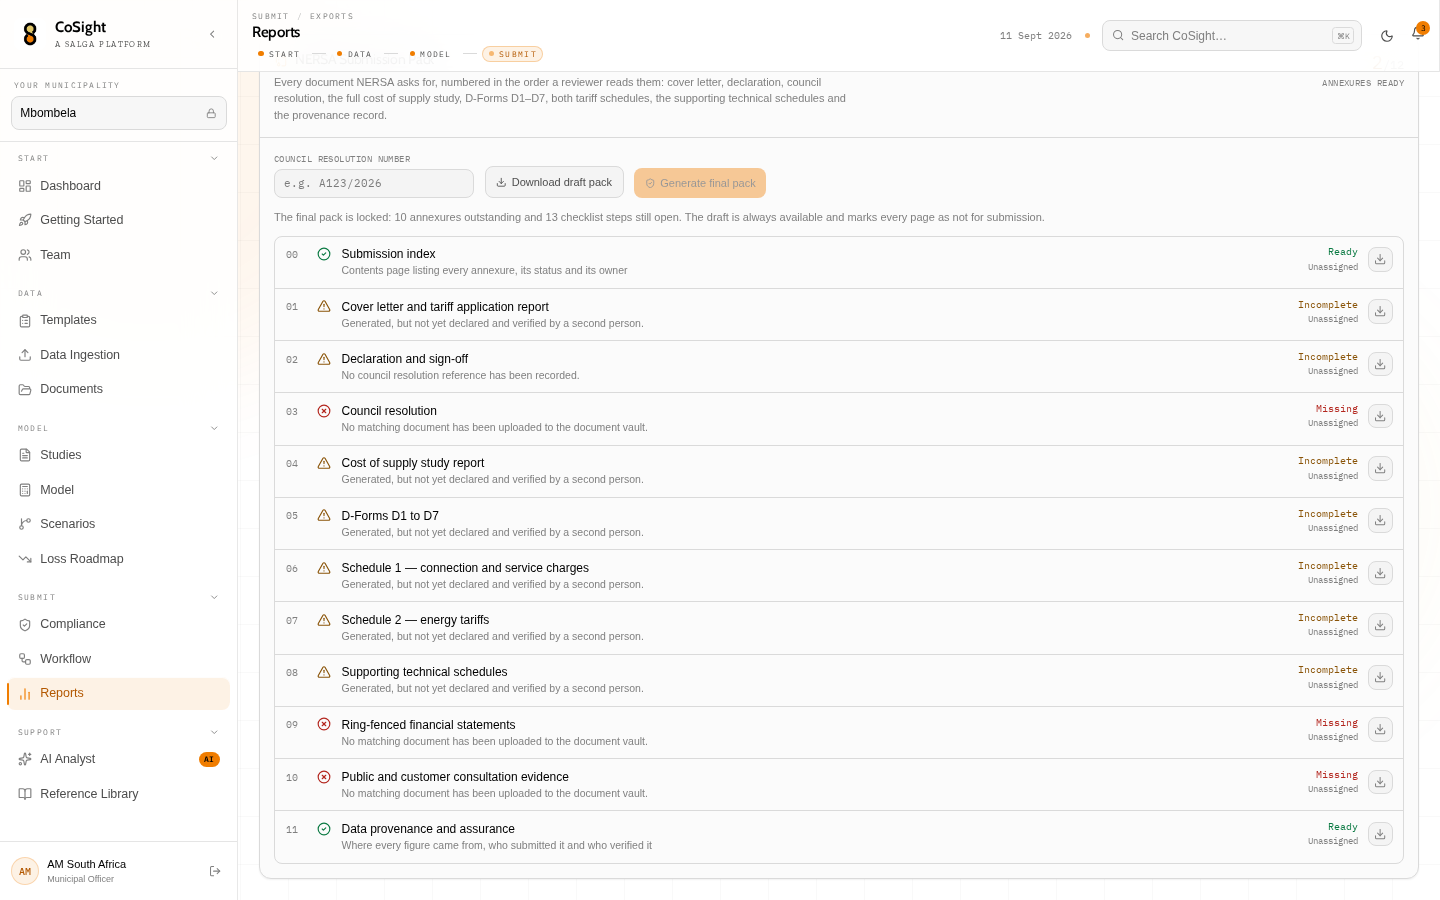
A number is only useful when the municipality can explain where it came from, who confirmed it and which document supports it.

Visible provenance
Source, fallback and confidence remain visible.
Named accountability
Owners and sign-offs sit beside the required evidence.
Phone-ready review
Councillors can review readiness and headline figures on mobile.
CoSight submission-readiness and report-pack view
Built around responsibility

One study. Clear roles.

SALGA

Portfolio oversight

Onboard municipalities, see progress across the portfolio and identify where support is needed.

MUNICIPALITY

Build the study

Collect evidence, run the model, design tariffs and move the submission through sign-off.

REVIEWER

Review the evidence

Use a phone or desktop to inspect assumptions, flags, source documents and readiness.

Your municipal workspace

Continue the Cost-of-Supply study.

Continue to log in